
“Identity work is priced by scope, research depth, stakeholder count and governance, never by the number of logo options. Here is the only accessible public compensation data, and what it leaves open.
Why no price list for identity work exists
No credible public benchmark fixes the price of an identity programme, and anyone who quotes a single figure is selling something.
What does exist is a compensation mix the ANA published from its triennial study reported in 2010, a wage floor the Bureau of Labor Statistics published for May 2025, and a set of scope clauses you can audit before you sign.
What a scope document is actually for
Identity work is sold as a project and produced as employment, and the scope document is where those two facts meet. It names the people who will be interviewed, the surfaces that will carry the identity, the number of revision rounds, the person who approves, and what happens when the brief moves after the work has begun. Each of those clauses shifts the number more than the count of logo routes ever will.
The ANA's triennial release is blunt about the pricing unit. Fee-based compensation appeared in 75 percent of plans, against 3 percent for traditional commissions and less than 1 percent for value-based methods. Counting deliverables is a way to describe a scope, not the thing this industry charges for. A proposal that prices three marks as three products is describing how it draws, not how it works.
What the fee has to cover, and what a rate card never mentions
A fee is built to cover
- Interviews with the sales, service and finance teams who will live with the identity
- Arbitration between departments before a single route is drawn
- An audit of live surfaces, from building signs to invoices and app listings
- Rules, templates and motion a marketing team can run without the studio
- A decision log with a named approver and agreed response times
A rate card never mentions
- Who gets interviewed, or how many voices the decision has to survive
- The cost of a brief that changes after the routes are approved
- Rollout order for signs, print, packaging and product surfaces
- What happens when two suppliers produce two versions of the same brand
- The record of what was rejected, which is the only defence in year three
The only accessible compensation benchmark, and its year
The ANA has run its Trends in Agency Compensation study on a triennial cycle for decades, and the 2022 edition is still the current one. The percentages below come from the edition reported in 2010, which the association published as a public release; the current eighteenth edition of 2022 is member-gated. Quote the mix with its year attached, or do not quote it.
| Compensation method | Present in | Reading |
|---|---|---|
| Fee-based | 75 percent | A defined scope at an agreed price, which is the dominant arrangement |
| Value-based | Under 1 percent | A special case rather than a trend |
| Traditional commission | 3 percent | The 2006 and 2007 survey recorded 16 percent |
| Sales commission | 15 percent | 41 percent where packaged goods are the category |
Read the same table from the other side and the practical question changes. If 75 percent of plans are fee-based, then the negotiation is not about commission rates or logo counts; the argument is about which hours the fee includes, how many weeks the senior team is actually attached to the project, and who absorbs the overrun when a review cycle drags.
The wage floor under every fee
A fee above the drawing pays for the people in the room. The Bureau of Labor Statistics published these medians for May 2025, and they are wages rather than fees, so treat them as the floor and not as a quotation.
62,960dollars a year
Median annual wage for graphic designers
Lowest tenth below 39,520 dollars; highest tenth above 104,910. Bureau of Labor Statistics, May 2025.
114,850dollars a year
Median annual wage for art directors
The people who sign off visual systems. Bureau of Labor Statistics, May 2025.
50,980dollars a year
Median for all occupations, the comparison baseline
Published in the same release as the design figures. Bureau of Labor Statistics, May 2025.
20percent
Graphic designers working for themselves in 2025
Bureau of Labor Statistics, Occupational Outlook Handbook, 2025.
Overheads, insurance, research, management and profit sit on top of those salaries, which is why two studios of similar size can quote very different numbers for one brief. The number worth interrogating is not the total but the resourcing behind it: named roles, seniority, the weeks each person is attached, and the party that absorbs an overrun.
Where price turns into performance
Four facts move an identity estimate more than any market rate. One concerns who signs the contract, two describe the market the work is sold into, and the last is about where that work is being built.
Incentives are a large-advertiser instrument
In 2010, 46 percent of respondents used performance incentives, a share barely changed from 47 percent in the 2006 and 2007 edition. The split by cheque size is the useful part: among advertisers spending above 30 million dollars a year, 70 percent had an incentive arrangement with at least one agency, while below that line the figure was 8 percent.
A regional developer negotiating an incentive clause is therefore buying a structure designed for someone else's scale.
Budgets as a share of revenue have been sliding for half a decade
The Drum's June 2025 analysis of agency commercial models describes marketing budgets as a share of revenue declining for five years, with agencies moving to value-based pricing, removed admin fees and guaranteed-results structures.
The same analysis notes that forecasters expect marketing revenues to rise faster than GDP in most major economies while the share of revenue stays flat. Price pressure in that world shows up as scope discipline, not as a discount list.
The current benchmark exists, but it is gated
The ANA's eighteenth edition of Trends in Agency Compensation was published in 2022 as member-only research. That is the reason this article uses the 2010 mix and labels it as such.
Any 2026 percentage presented as the industry benchmark should be asked three questions: what sample, what date, and who paid for the study.
Premium positioning is what regional buyers are paying for
In its 2025 survey, Knight Frank recorded the Middle East holding 26.7 percent of the global branded-residence pipeline against 15.9 percent of live schemes, and named developers' appetite for premium positioning as one of two demand drivers.
Premium positioning is a scope decision: more languages, more surfaces, more approvals per project, and an identity that has to hold in Dubai, London and Riyadh at the same time.
Where the weeks actually go
-
01
Inputs
Interviews with sales, service and operations, plus an audit of what already carries the name in the market. This is the step that turns a preference into evidence.
-
02
Arbitration
Founders and department heads agree, in writing, what the brand promises and what it refuses to be. The agreement is signed before anything is drawn.
-
03
Routes
Design is presented against the agreed decision rather than against taste, which is why the review meeting has a written reference instead of a favourite.
-
04
Applications
The surfaces that carry the identity are named in priority order: signage, print, packaging, product, recruitment, digital.
-
05
Governance
A named approver, response times, and a route for suppliers to request an extension of the system rather than inventing one.
-
06
Enablement
Templates, source files, motion rules and a decision log, handed over with a working session for the team that will run the system.
The revision round is a unit of risk
Two rounds of revisions means different things in different contracts. In one studio it is two passes of corrections; in another it is two rebuilt systems. The clause that removes the ambiguity is a written definition of what counts as a change: correcting an error inside the agreed brief, or taking a new decision after the routes were approved. That definition is worth more to a buyer than an extra round.
There is a second reason to write it down. A tight cap on revisions pushes studios to over-scope early and pad the estimate, so a fixed price grows even when the work has not changed. Locking the inputs and defining the revision honestly is cheaper than paying for guesswork in either direction.
Where the 33 percent figure comes from
The most repeated number in this market is a revenue uplift, and its paper trail is worth reading before it enters a board deck. Lucidpress published its State of Brand Consistency Report on 2 December 2019, stating that consistent branding can increase revenue by 33 percent, described in the release as a 10 percent increase over the 2016 edition, with 81 percent of companies still dealing with off-brand content and more than 200 organisations surveyed.
None of that makes the figure false. It makes it a company claim about the vendor's own category, and a number that cannot be compared across markets, sectors or company sizes. The working rule for this article applies to it: if the sample is not published, the number is not a benchmark.
Companies will continue to struggle with off-brand content as demand for content continues to grow with 50% of organizations creating more content this year than the year prior.
The reality check on every published price list
Two ways to buy the same discipline
Buy the scope
Several audiences, external suppliers, a rollout across many surfaces, or a name that has to hold for a decade.
Buy the drawing
One product, one decision-maker, and no plan to hand the identity to other teams within two years.
A fee buys decisions as much as artwork. Insist on five artefacts that make it defensible: the research record, the applications audit, the digital rules, the naming and architecture decisions, and the decision log with named approvers. A written proposal accounts for all five and for the people who sign them; anything thinner is a mark with a longer schedule. The difference between the two kinds of firm is set out in what separates a branding agency from a logo shop.
Buy the drawing knowingly, and price the coordination it creates: every supplier answers to you, every application is approved by eye, and two agencies can still deliver two different brands in one quarter. That labour rarely appears on an invoice, which is exactly why it should be named before the first signage order.
What an identity has to survive
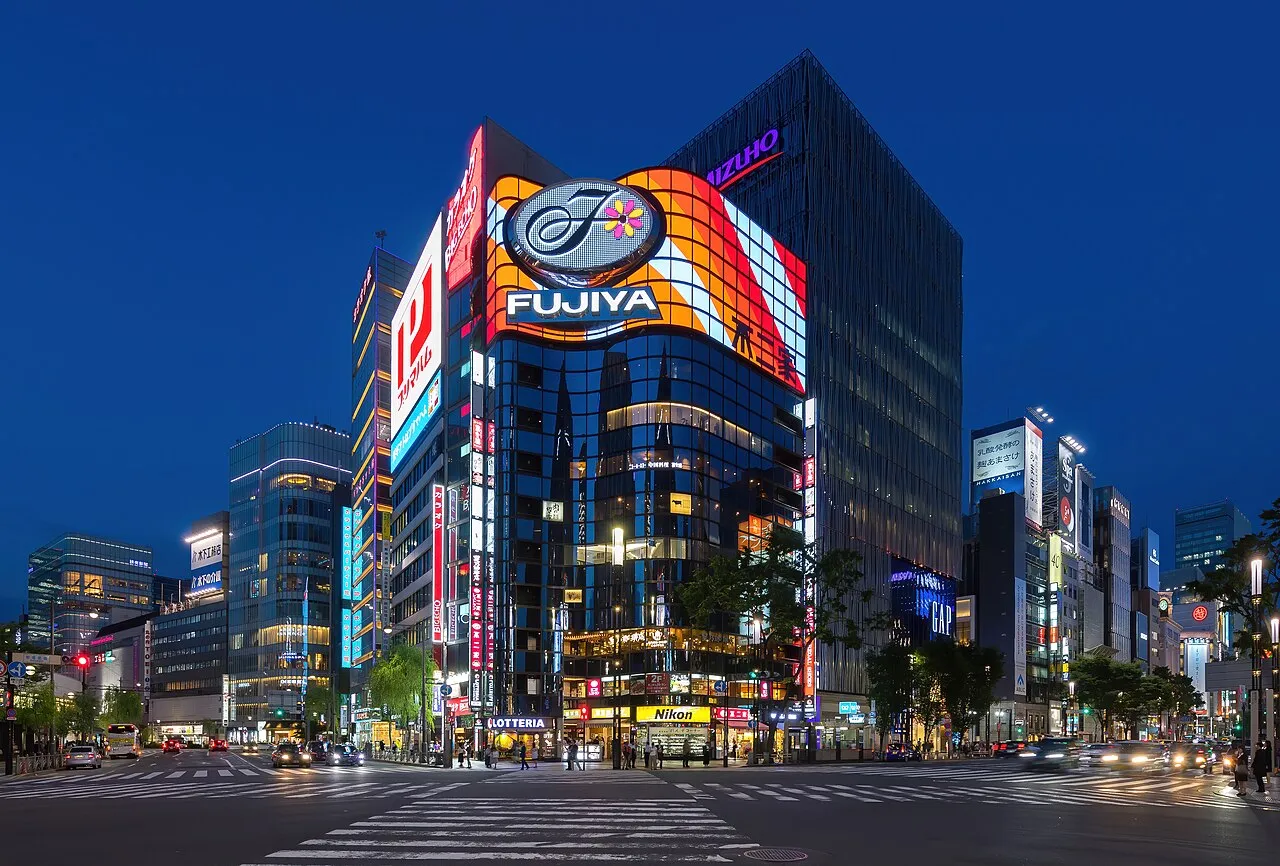
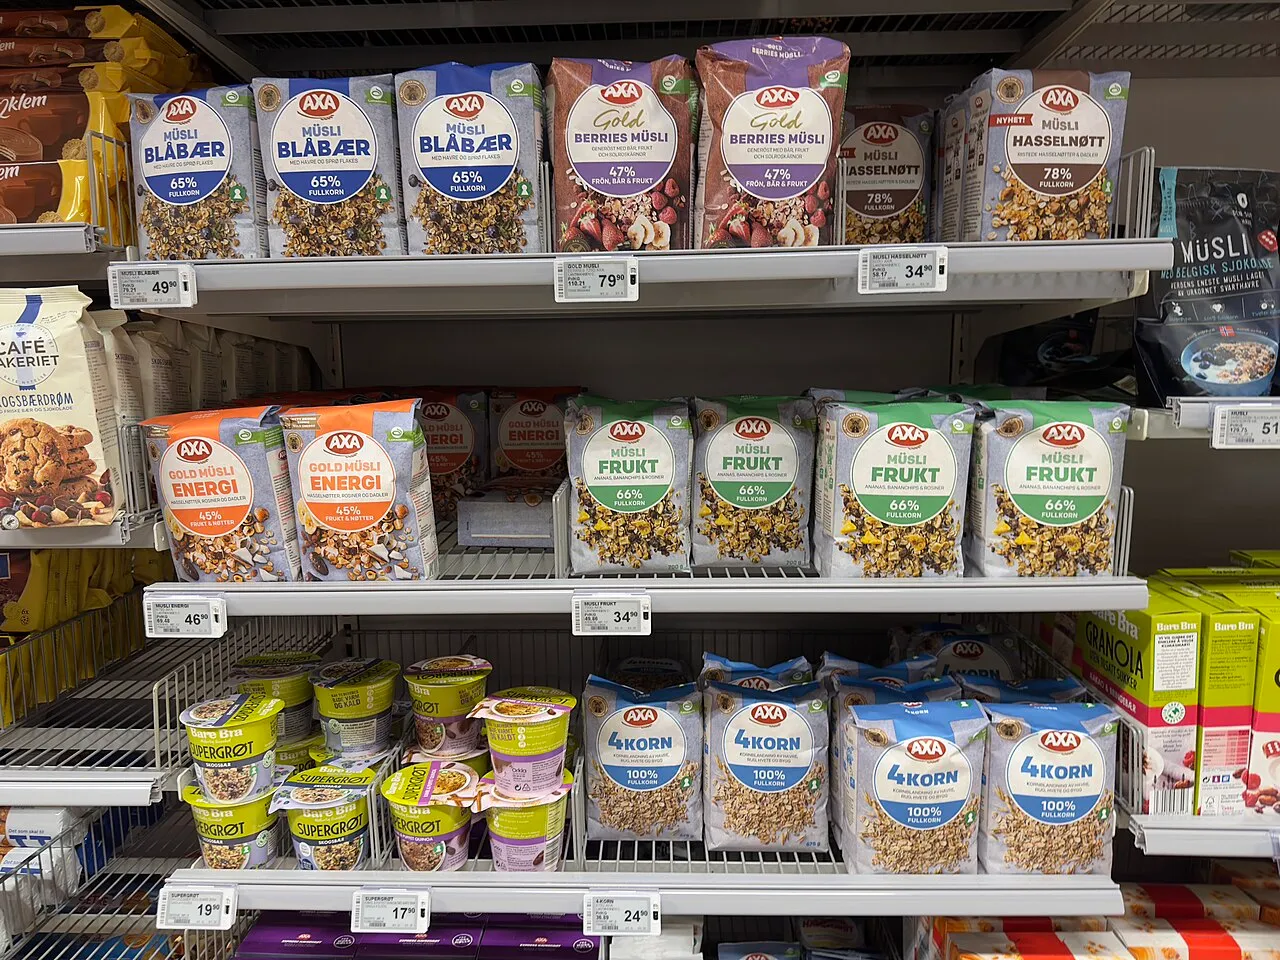
Presentations flatter identity work, so they are a poor test. A corner shop at night, a street of competing signs and a supermarket shelf each ask something different: contrast from a distance, legibility in motion, and being chosen at a glance. Photographs of places people actually walk through tell you more than a screen mockup can.

What to do with this on Monday
- Ask for the scope clauses, not a price band.Fee-based compensation runs 75 percent of advertiser plans in the ANA's 2010 study, so the clauses are the product.
- Name the decision-maker before design starts.The ANA found in 2010 that incentives were used by 70 percent of advertisers spending over 30 million dollars a year, against 8 percent below that line; the structure follows the buyer.
- Treat salary data as the floor.United States salary data for May 2025 puts the median graphic designer at 62,960 dollars and the median art director at 114,850.
- Define the revision in writing.A change is a new decision, not a correction of an agreed error, and the difference decides who pays.
- Keep the year attached to any percentage.The accessible compensation mix is from 2010 and the 2022 edition is member-gated; a figure without a sample is marketing.
- Write the rollout order into the fee.Signage, print, packaging, product and digital surfaces are scope, and unbudgeted surfaces are where a fixed price breaks.
Sources
- ANA survey finds fees persist as dominant method of agency compensation — Association of National Advertisers, 2010
- Trends in Agency Compensation, 18th Edition — Association of National Advertisers, 2022 (member-gated)
- Graphic Designers — Occupational Outlook Handbook, US Bureau of Labor Statistics, May 2025
- No admin fees, value-based models, guaranteed results: A new era of agency contracts — The Drum, June 2025
- Study finds companies with consistent branding can see up to 33% increase in revenue — Lucidpress via PR Newswire, 2 December 2019 (company claim)
- The Global Branded Residence Survey 2025 — Knight Frank, September 2025