
“A UX audit earns its budget when every finding carries a revenue touchpoint and a reversal cost. Baymard's checkout data and the Core Web Vitals thresholds are the two halves of that argument.
An audit is a ranking, not a set of screenshots
If an audit does not say which problem costs the most money, it is a design opinion with page numbers.
Heuristic evaluation has a published method and checkout research has measurable counterparts, and both belong in the same report as field performance data.
What the audit is actually ranking
The output of a useful audit is an ordered list in which each item carries two scores: the revenue touchpoint it plausibly affects, and how cheaply the change can be reversed if the data disagrees. A finding without either score is a preference, and preferences do not survive a budget meeting.
The ordering is what makes the document predictive rather than descriptive. Baymard Institute's meta-analysis of 50 studies puts average cart abandonment at 70.22 percent, and the same research programme names why people leave. Once the reasons carry percentages, prioritisation stops being a matter of taste and starts being arithmetic.
How a heuristic pass is run
-
01
Freeze the scope and the build
Name the flows under review, the device classes in scope and the date the build was frozen. An audit that quotes a moving target produces findings that are already stale when the report lands.
-
02
Run three to five independent evaluators
Nielsen Norman Group's method calls for 3 to 5 evaluators working independently, with each pass timeboxed to 1 to 2 hours, so that findings are not shaped by one reviewer's stamina or blind spots.
-
03
Consolidate into one list, keeping the disputes
Merge duplicates, write each finding as a problem rather than a missing feature, and keep the items where two evaluators disagreed. The disagreement is usually where the real design question lives.
-
04
Score before you recommend
Attach the revenue touchpoint and the reversal cost to every item, then publish the top ten as the headline and the remainder as an appendix. A fifty-item report with no order is a to-do list nobody owns.
The four figures a checkout audit starts from
70.22percent
Average cart abandonment across Baymard's meta-analysis of 50 studies
Baymard Institute, updated 22 September 2025.
40percent
Abandonment attributed to extra costs, the largest named reason
Excluding browsing. Baymard Institute, 2025.
18percent
Abandonment attributed to forced account creation in the current list
Baymard Institute, 2025. An older widely quoted figure put this at 26 percent.
23.48elements
Form elements in the average US checkout, against an ideal of 12 to 14
14.88 of them are fields; the ideal is 7 to 8 fields. Baymard Institute, 2025.
The named reasons, in the order they cost money
| Reason buyers give | Share of non-browsing abandonment | Where the fix usually sits |
|---|---|---|
| Extra costs are too high | 40 percent | Costs shown before the payment step |
| Delivery is too slow | 20 percent | Delivery promises stated on the product page |
| Payment security is distrusted | 19 percent | Payment method, reassurance and page trust |
| An account is forced | 18 percent | Guest checkout or a later registration step |
| Checkout is long or complicated | 17 percent | Field count, structure and progress |
| Total cost cannot be seen | 12 percent | Order summary placement and honesty |
The two figures to stop recycling
The first is a latency claim: that Amazon loses one percent of sales for every hundred milliseconds of added load time. The sentence appears in almost every audit template, and no primary Amazon publication of the number was found, which is precisely why it does not belong in a document that is asking for engineering time.
The second is forced account creation as 26 percent of abandonment. That is an older widely quoted figure, and Baymard's current list records 18 percent, behind extra costs at 40 percent. Recycling a number that has already moved is how a well-built audit loses the room in its first five minutes.
Three layers of evidence, in the order to buy them
What the interface gets wrong
The cheapest structured layer: 3 to 5 independent evaluators, passes timeboxed to 1 to 2 hours, findings mapped to the ten heuristics that Jakob Nielsen and Rolf Molich set out in 1990 and that have been stable at Nielsen Norman Group since 1994.
It finds interface problems without recruiting a single participant, and it cannot tell you how often they occur. That limit is why the second layer exists.
How far the flow sits from published field data
This layer compares your checkout against documented behaviour rather than the reviewer's taste: 70.22 percent average abandonment across 50 studies, extra costs named by 40 percent of abandoners, forced account creation by 18 percent, and an average US checkout carrying 23.48 form elements against an ideal of 12 to 14.
The comparison converts a finding into a gap a product owner can act on, and a field reduction of 20 to 60 percent is described as achievable in the same research.
What the field actually measures
Core Web Vitals are rated at the 75th percentile of real visits against fixed thresholds: largest contentful paint at or under 2.5 seconds, interaction to next paint at or under 200 milliseconds, and cumulative layout shift at or under 0.1, as set out by web.dev in 2024.
A checkout that answers slowly loses people before any wording question matters, which is why the performance column belongs beside the interface findings.
Performance belongs in the same document
The belief that an audit is an interface document fails in a measurable way. Core Web Vitals are field-measured on real visits at the 75th percentile against thresholds that do not move with opinion, and the set changed in 2024 when interaction to next paint replaced first input delay.
That change is a useful test of the reviewer. An audit still quoting first input delay is quoting a superseded standard, and any engineer in the room will notice. Rank a button label above a slow payment step and the report has mispriced the problem before the second page.
What the report has to contain to change a decision
The scope, the build and the dates
Name the flows, the device classes, the frozen build and the day the review started. Nielsen Norman Group's method is explicit about the setup, and a finding without a version cannot be closed or verified later.
This sounds administrative. It is the difference between a report a team can action and a report a team can only admire.
The evaluator count and the heuristic set
Three to five independent evaluators, passes timeboxed to one or two hours, and the ten heuristics as the checklist. A report that hides its method is asking the reader to trust the author's eye instead of a published instrument.
Method transparency is also what makes two audits comparable a year apart, which is how a team proves progress.
A ranked list with two scores per item
Every finding carries the revenue touchpoint it affects and the cost of reversing the change. The highest-value item is often not the ugliest screen: extra costs are named by 40 percent of abandoners while account creation is named by 18 percent, and the fixes look nothing alike.
Ranking also protects the report from the loudest person in the room.
The performance column, measured rather than asserted
Field data at the 75th percentile, against the thresholds web.dev sets: 2.5 seconds for largest contentful paint, 200 milliseconds for interaction to next paint, 0.1 for cumulative layout shift. Screenshot evidence for interface findings and a chart for the performance ones.
A performance claim without field data is a benchmark run on the reviewer's laptop.
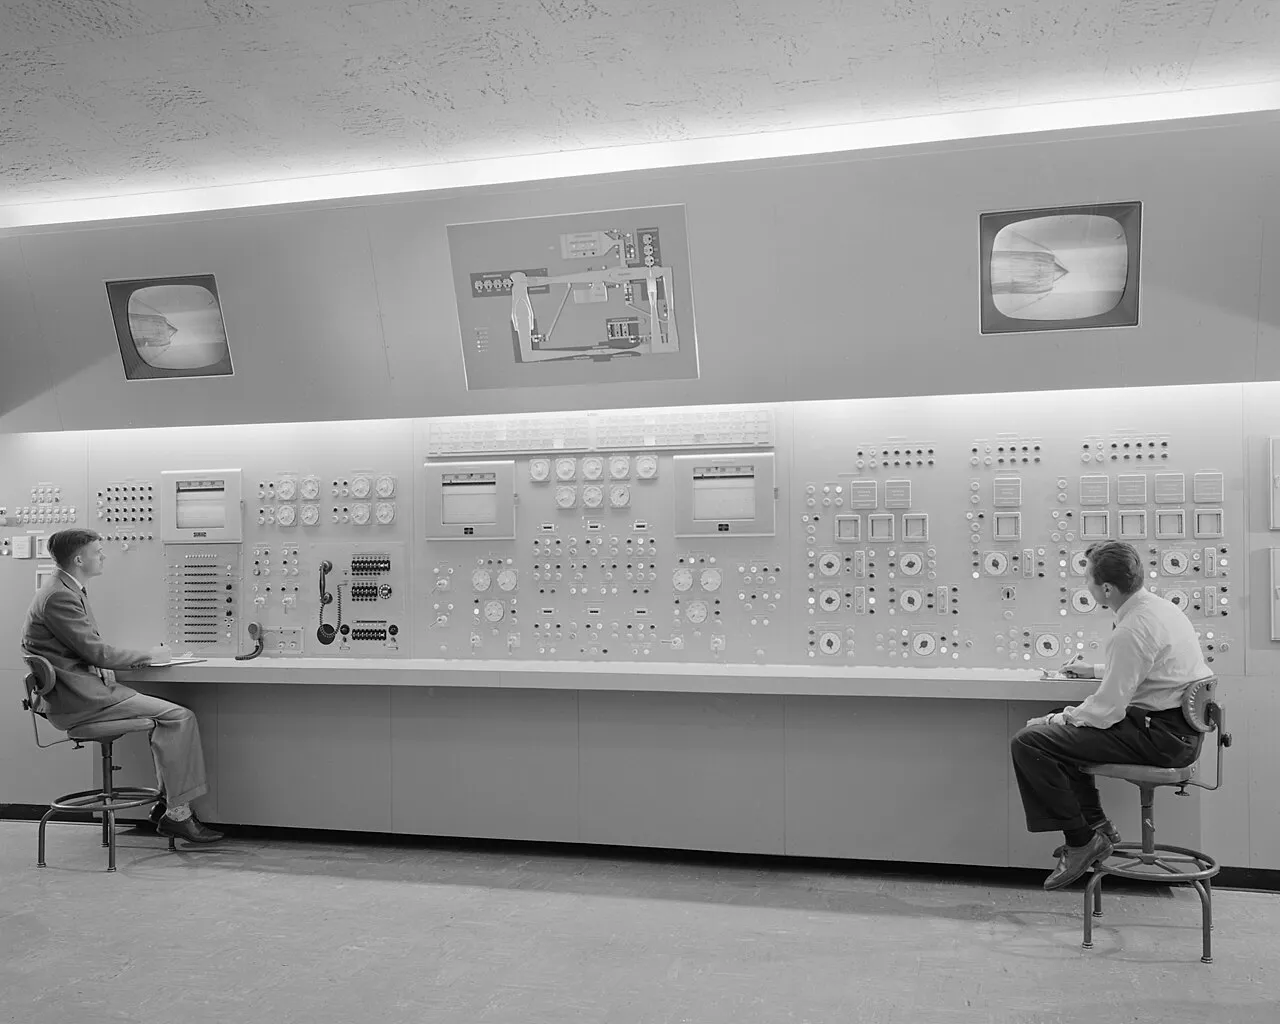
Control surfaces show what monitoring demands
An audit is a monitoring exercise: someone has to read the state of a system from the outside and report it. The three photographs below are control rooms, one in broadcasting and two in engineering programmes, where that reading is a daily discipline rather than a quarterly document.


What to do with this on Monday
- Score every finding twice before publishing.One score for the revenue touchpoint and one for how cheaply the change can be reversed if the data disagrees.
- Run the pass with three to five independent evaluators.Nielsen Norman Group's method timeboxes each pass to one or two hours, and the disagreements it produces are the useful part.
- Read 70.22 percent as the baseline, not the story.Extra costs are named by 40 percent of abandoners and forced account creation by 18 percent in Baymard's 2025 list.
- Count the form elements before redesigning the page.The average US checkout carries 23.48 elements against an ideal of 12 to 14, and a 20 to 60 percent cut is described as achievable.
- Put the field numbers in the same document.Core Web Vitals are rated at the 75th percentile: 2.5 seconds, 200 milliseconds and 0.1, with interaction to next paint replacing first input delay in 2024.
- Delete the latency claim with no primary source.The sentence attributing a one percent sales loss per hundred milliseconds to Amazon does not belong in an audit.