

“Dubai’s aggregate property transaction value rose from AED 761 billion in 2024 to AED 917 billion in 2025, according to the cited government communications. The comparison is useful for market context only when the definition stays attached to the numbers and the reader can inspect the source.
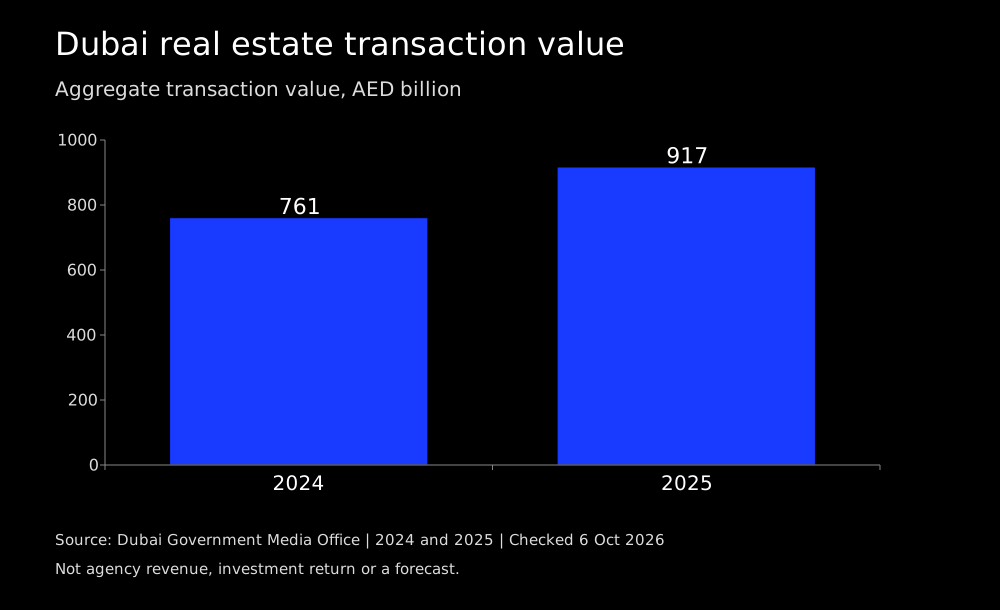
Dubai’s aggregate property transaction value rose from AED 761 billion in 2024 to AED 917 billion in 2025, according to the cited government communications. The comparison is useful for market context only when the definition stays attached to the numbers and the reader can inspect the source.
Compare the same aggregate measure
Both figures refer to aggregate real estate transaction value in Dubai for a calendar year. They do not describe brokerage revenue or a sales-only measure. Keep that definition in the title of the chart and its accessible table, rather than shortening the label to property sales for a more dramatic headline.
Explain the arithmetic
The difference between the published values is AED 156 billion. Dividing that difference by the 2024 value gives approximately 20.5 percent; this is an editorial calculation from rounded totals. It is not a separate official growth estimate and should not be shown with greater precision than the underlying source values support.
Avoid the individual-property inference
An increase in the aggregate value does not establish that every property appreciated by the same percentage. Transaction counts, asset mix and other components can affect a total. A property campaign still needs evidence relevant to its location and asset type, instead of translating a citywide result into a guaranteed return for a buyer.
Present the period visibly
The graphic below is a historical comparison of 2024 and 2025, reviewed on 6 October 2026. It is not a live 2026 dashboard. If reused in a presentation or social asset, retain the years, currency, aggregate definition and source link. A beautiful chart becomes misleading when a crop removes those boundaries.
Keep the comparison intact when shared
If the Dubai graphic is exported into a short presentation, retain both years and the aggregate transaction-value label. The derived difference and growth calculation should remain identified as calculations from rounded source totals. Do not crop the graphic into a standalone percentage claiming capital appreciation. A shared asset should still let a reader trace the figures to the two government communications.
| Measure | Period | Value |
|---|---|---|
| Aggregate transaction value | 2024 | 761 billion AED |
| Aggregate transaction value | 2025 | 917 billion AED |
Sources and review date
Primary sources reviewed on 6 October 2026: Dubai Media Office 2024 transaction value; Dubai Media Office 2025 transaction value.
Your next practical step
Use the supplied table and graphic as historical context, then research a separate, relevant dataset before making a claim about a particular development. Explore the relevant Gameel service to turn the approved brief into clear public communication.