
Sources checked: 6 October 2026
Reading developer numbers: sales, revenue and backlog
A broker's guide to interpreting company disclosures and producing accurate presentations. These examples use full-year 2025 company announcements and do not imply a Gameel client relationship.
Emaar: annual property sales across two years
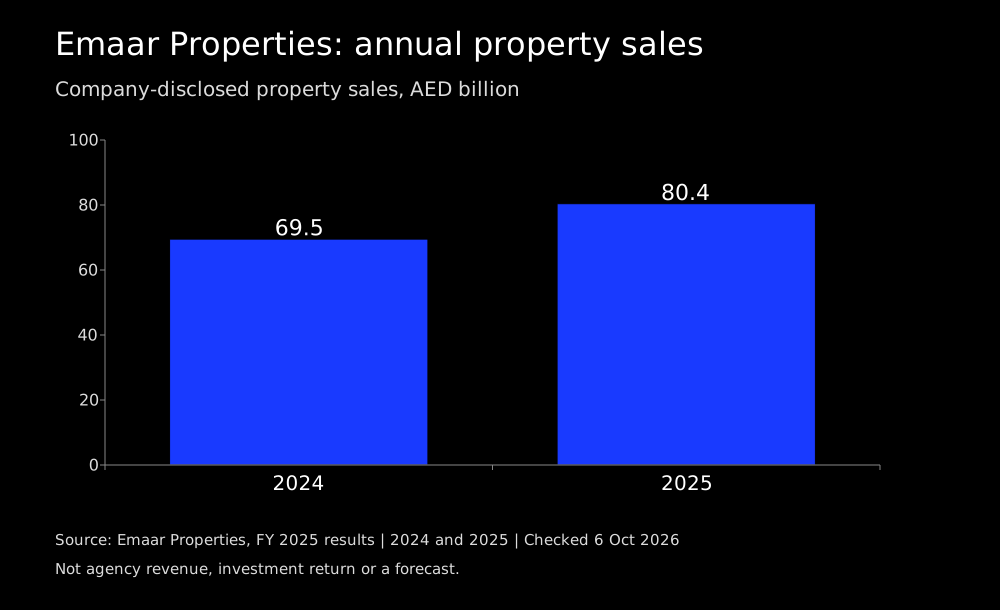
The arithmetic difference is AED 10.9 billion. Using the rounded values gives about 15.7%; the official announcement reports a rounded 16% increase. Emaar's 12 February 2026 disclosure.
Keep the metric and reporting scope visible
| Company | Metric | Period | AED billion |
|---|---|---|---|
| Emaar | Property sales | 2025 | 80.4 |
| Emaar | Group revenue | 2025 | 49.6 |
| Emaar | Revenue backlog | 2025 year-end | 155 |
| Aldar | Group sales | 2025 | 40.6 |
| Aldar | Group revenue | 2025 | 33.8 |
| Aldar | Development revenue backlog | 2025 year-end | 71.7 |
Sources: Emaar full-year results and Aldar's 9 February 2026 results. The groups have different business and geographic scopes. This table defines disclosed metrics; it is not a market-share ranking. Do not add sales, revenue and backlog together as separate earnings.
A number-review workflow before publication
This is an editorial review workflow, not an accounting standard. For a brokerage report, define transaction count, value, commission and recognition stage. Have the responsible finance professional check the figures before publishing them.